Minnesota grows a bit older, less white, more metropolitan

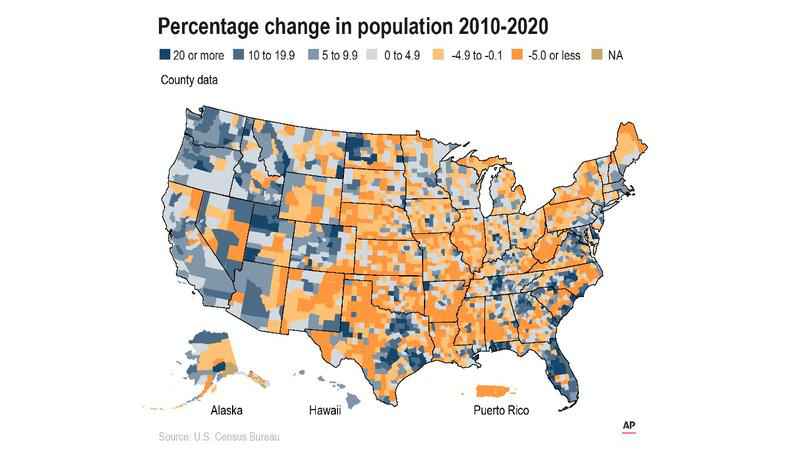
A county map of the United States and Puerto Rico shows percentage change in population 2010 to 2020.[AP Photo]
Minnesota grew a little bit older, a little bit less white and a bit more metropolitan, according to census data released Thursday.
The 2020 data release from the U.S. Census Bureau provided the first detailed look at population and demographic shifts within each state and how the population is diversifying across the country. Broader figures released earlier this year show Minnesota’s population grew from 5.3 million in the 2010 count to 5.7 million in 2020, an increase of 7.6%, which was just barely enough to let the state keep all eight of its congressional districts.
One of the biggest things at stake in the new census numbers is the state’s political map, which must be redrawn in time for the 2022 elections to reflect population shifts since the 2010 census. Much of the battle will be over the suburbs, as it will be nationally.
State Demographer Susan Brower said in an interview that the changes didn’t surprise her, “but seeing it in concrete numbers, it has real-life consequences in terms for redrawing political districts, for distributing funds and planning purposes — for all the ways people use census data.”
Here are some highlights from the census data on how Minnesota has changed from 2010 to 2020:
GROWTH
Brower said the data show that 78% of Minnesota’s growth came in the Minneapolis-St. Paul metropolitan area, but there were also pockets of growth in other parts of the state.
The 2010 census showed an “explosion of exurban growth” on the egdes of the Twin Cities area, she said, whereas the new data show “a very different growth pattern” of gains not only within the urban core, but also in suburban counties and some elsewhere that include larger cities such as Olmsted and Stearns, which include Rochester and St. Cloud, respectively.
ETHNICITY
The state where George Floyd’s death set off a nationwide reckoning on race remains overwhelmingly white, though not by quite as much. The population identifying as white alone slipped from 83.1% in 2010 to 76.3% in 2020. But the population identifying as Black alone increased from 5.1% to 6.9%, those identifying solely as Hispanic or Latino increased from 4.7% to 6.1%, and Asians rose from 4.0% to 5.2%. American Indians held steady at 1%. The population identifying as two or more races but not as Hispanic or Latino increased from 1.9% to 4.1%.
Whites remain the largest racial group in every Minnesota county. The state’s most diverse county is Mahnomen in the northwest, which lies within the White Earth Reservation. Native Americans make up 41.7% of the county’s population, compared with whites at 42.1%. It’s Minnesota’s only county where whites aren’t the majority. Lincoln County in southwestern Minnesota is the least diverse, with a population that’s 95.2% white, compared with 2.1% identifying as multiracial but not Hispanic/Latino, and 1.9% Hispanic or Latino.
AGE
Minnesotans age 18 and older make up 76.9% of the state’s population. The 18-plus population rose 9.2% from 2010 to 2020 while the growth in the under-18 population lagged at 2.6%. Minnesota’s oldest county is Cook in the northeastern corner of the state, where people 18 and above make up 84.1% of the population, while the youngest is Mahnomen with 71.3% who are 18 and older.
REDISTRICTING
The data shows a shift in population away from rural counties in southern, western and northern Minnesota toward the Twin Cities metropolitan area, particularly the suburbs. The numbers suggest three rural congressional districts will need to add territory while two urban and three mostly suburban districts will need to shrink, assuming the mapmakers opt for incremental changes. The number also reinforce the likelihood that rural Minnesota will lose legislative seats to the Twin Cities area.
It remains to be seen whether the divided Minnesota Legislature can accomplish the task of redistricting, given the high stakes for Republicans — who barely control the Senate — and Democrats, who only narrowly control the House. History suggests that the task will fall to the courts once again.
But Democratic House Speaker Melissa Hortman, of Brooklyn Park, expressed optimism for her party and the chances of the Legislature finding a solution on its own.
“I think a new, fair map should be favorable to Democrats because the population growth that we’ve seen is predominately in the suburbs and the city, and those are areas where Democrats are currently very strong,” Hortman said in an interview. “We’ve seen a transition in the suburban communities from being very Republican to being very Democratic. And I think that’s largely as the Republican Party became the party of Trump, it solidified their loss of the suburbs.”
The speaker said the reason she thinks the Legislature can redraw the maps without help from the courts is that she chose Democratic Rep. Mary Murphy, of Hermantown, to chair the House Redistricting Committee. Hortman credited Murphy with brokering a record $1.9 billion public works bonding bill just a few weeks before the contentious 2020 elections and assembling the bipartisan supermajorities needed to pass it in each chamber.
“If anyone can do it, chair Mary Murphy can,” Hortman said.